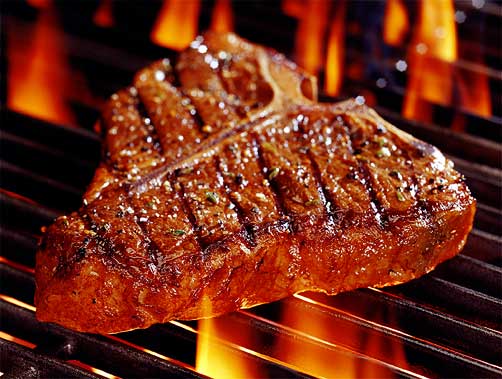
 When I was a kid, science infographics consisted of outdated black-and-white films, the Periodic Table, and diagrams of the human body. For some reason, when I turned 13 I kept hoping the graphics would all be women, but that’s another story. Courtesy of besthealthsciencedegree.com, this infographic explains the science of steak. Tasty, tasty science.

Image compliments of Best Health Science Degrees
The following two tabs change content below.


Managing Editor | Mark is a freelance journalist based out of Los Angeles. He’s our Do-It-Yourself specialist, and happily agrees to try pretty much every twisted project we come up with.
Latest posts by Mark Masker (see all)
- 2024 Scovie Awards Call for Entries - 07/07/2023
- 2024 Scovie Awards Early Bird Special: 3 Days Left - 06/29/2023
- 2024 Scovie Awards Early Bird Deadline Looms - 06/25/2023


